This is the second blog in the series of ‘Best Practices in Crafting Effective Surveys, Data Analysis and Visualization’.
Just like to cook the perfect dish, you need to choose ingredients carefully and blend them in a measured manner; it is essential that your survey blueprint also has all the required questions in place, suitably worded, to gather increased as well as accurate responses. Moreover, as much as the mix of a variety of spices adds the right flavour and aroma to your final dish, the combination of different question types not only enhances the survey’s visual appeal, but also enables an increased response rate, helps arrive at precise results and extract the maximum value from the answers received. In my first blog we discussed how the quality of questions asked significantly impacts the quality of answers given. In this blog, we will go a step further and explore the world of different question types that add value to our survey design.
Similar to how before choosing ‘horses for courses’, it is important to understand not only the skills of the competing horse, but also the nature of the course it will be racing on; before you embark upon the process of choosing the survey question types, it is essential to be mindful of the research objectives, the type of variables to be studied and the outcomes desired. At a broader level, survey questions can be in a closed- or open-ended format. While the former incorporates predetermined answer choices and is objective in nature, the latter encourages the participant to key in a response in their own words, highlighting their perspectives/opinions and is more subjective in nature. Detailed below is a suggestive list of major question types, based on the variables under consideration, which can be used while drafting a survey questionnaire:
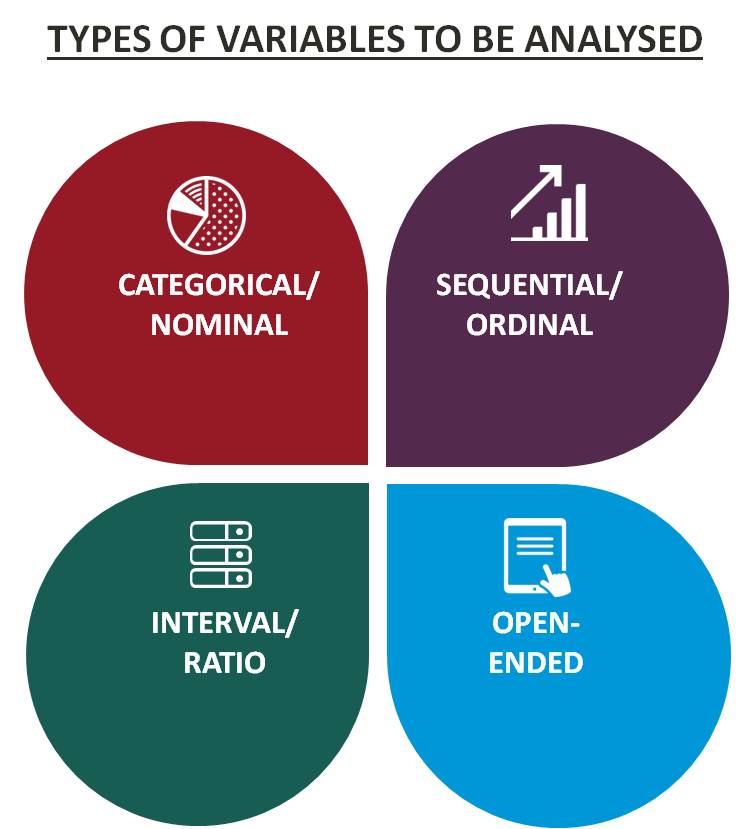
- CATEGORICAL/NOMINAL VARIABLES:
These are easy-to-analyze variables that can be classified into two or more groups and there is no inherent ordering to the categories. Best represented by closed-ended questions, these variables can be analysed using simple counts and percentages, such as, number of respondents fulfilling a particular criterion or percentage of customers purchasing a specific food item. Further, these variables can be utilized to compute averages, median, percentiles etc. or test correlations as well. The question types that can be used to analyse these variables are as follows:
-
- Dichotomous (‘Yes/No’) – These are questions that have only two distinct answers – ‘yes or ‘no’ and are also helpful in phasing out people not relevant to your survey. For example,
Q. Have you traveled overseas in the last 6 months?
-
- Radio Button (Single Answer) – With three or more preset answer options, these questions offer a more granular analysis than the ‘yes/no’ type question. While these questions (mostly) offer mutually exclusive choices and better survey-taking experience for the respondents, they also make data analysis much simpler as participants can only choose one answer option, rendering structured responses. For instance,
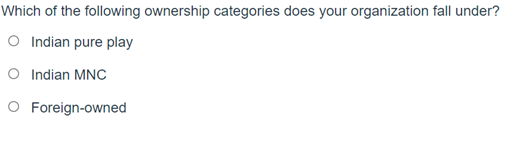
Also, in case the answer choices are not mutually exclusive or are not relevant to the participants, for the sake of completeness, consider adding an editable ‘Others/Comments’ field at the end, so that respondents can type in their answers.
-
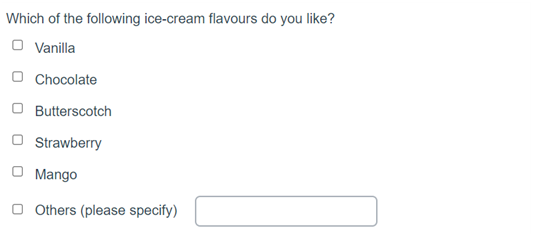
- Multiple-choice (Many Answers)/Checkbox - A variation of the ‘Radio Button (Single Answer)’ question type, multiple-choice/checkbox questions also inculcate multiple predefined answer options, but with the flexibility of choosing more than one answer. These question types are suitable when respondents cannot give a clear-cut single answer and would like to pick multiple options, such as reasons/factors for a particular action.
Again, it would be wise to provide an editable ‘Others/Comments’ field at the end, so that participants have the freedom to write/add anything they want to. Moreover, it would be useful to add a phrase like ‘of the following’ in the question, to set the expectations of the participants beforehand, that you are about to give them some indicative options. For example,
-
- Dropdown (Single/Multiple Answers) – These question types offer another way of presenting ‘Radio Button (Single Answer)’ or ‘Multiple-choice (Many Answers)/Checkbox’ questions. By displaying a scrollable list of answer options, participants get a meaningful framework to work with, and they can browse through all the answer choices at once. Participants can then select one answer, in case of Dropdown (Single Answer), or multiple options in case of Dropdown (Multiple Answers). For instance,
DROPDOWN (SINGLE ANSWER)-
DROPDOWN (MULTIPLE ANSWERS)-
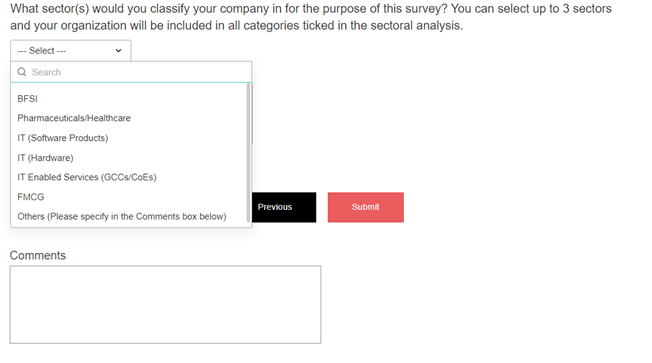
Moreover, since survey platforms may not provide for an ‘Others (write-in)’ box for dropdown questions, it would be advisable to add an option as ‘Others (please specify in Comments box below)’ in the Dropdown Menu, appended with a writable ‘Comments’ box below (as shown in the above screenshot), for respondents to answer accurately.
- SEQUENTIAL/ORDINAL VARIABLES:
When answer choices follow a clear logical order, such as revenue of <Rs 1,000 crores, Rs 1,000-2,500 crores, Rs 2,500-5,000 crores and >Rs 5,000 crores, they constitute sequential/ordinal data and are also suitably represented by closed-ended questions, capable of being analysed using simple counts and percentages. However, we cannot compute averages or test correlations with sequential data. The answer options should be listed in a consistent order, ‘smallest to largest’ or ‘largest to smallest’. Moreover, since the categories of data have a natural progression, or given that you wish to analyse them in the form of an order or rank provided by the respondent, Radio-Button, Dropdown (Single Answer) or Ranking questions (as explained below), are the apt choices for question types.
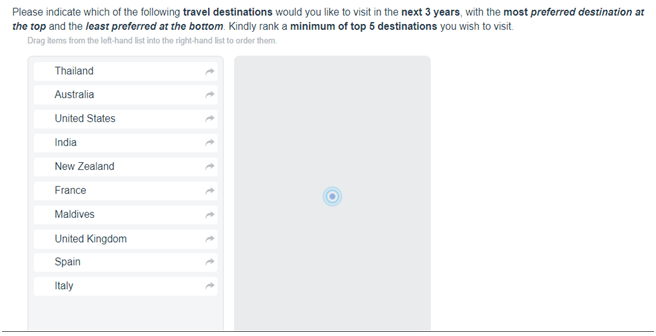
- Ranking – Rank order questions attempt to gauge each respondent’s order of liking/preference, frequency of use or perceived value, by enlisting choices. This helps the surveyor not only gain meaningful insights into how participants perceive each answer option, but also understand each option’s relative popularity. However, the survey writer needs to be mindful of the following points while drafting ranking questions:
- The participants should be familiar with the answer choices and answers should not be such that are open to interpretation. For example, if we ask respondents to rate their favourite shows on Netflix with predefined answer options, some respondents might not be aware of those shows and may skip/randomly answer the question, leading to incomplete/biased results.
- Elucidate how the interface works and clarify which end of the scale annotates what. For instance, elaborate the question as ‘drag and drop the listed items, from the left to the right column, in order of preference, with the most preferred item on top and the least preferred item at the bottom’.
- Specify clearly the context in which you would like the participant to compare and rank the options. Illustratively,
- INTERVAL/RATIO VARIABLES:
These variables define values measured along (preferably) a balanced scale, where each point is conceptually equidistant from each other. Interval questions are frequently asked on a scale ranging from 1 to 3, 5 or 7 options, wherein, for example, 1 could denote ‘Strongly Agree’ and 3, 5 or 7 could denote ‘Strongly Disagree’ or vice-versa. Contrarily, ratio questions have a true zero and require participants to input an actual number or percentage into the survey field, such as ‘How many pets do you have? _____’ could have 0 as an answer.
These variables provide for advanced and thorough analysis, such as calculating averages, medians, percentiles, testing correlations, running regression etc., and can be suitably asked through closed-ended question types. The question types that can be used to aptly capture these variables are as follows:
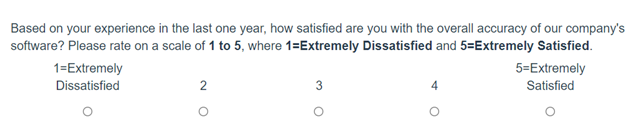
- Rating Scale – The most popular choice for interval questions are rating scale questions, which are essentially single-answer questions with answer options mostly presented in a horizontal line. A balanced scale with (ideally) odd-number of answer options ranging from, say, 1 to 3, 5 or 7 options in the form of Net Promoter Score® (NPS) questions, Likert Scale, Star Rating Grid, a never/always scale, like/love scale, or any other ratio interval question, helps gain accurate insights into the respondents’ likings/preferences and further helps in understanding the overall sentiment of participants with regard to the parameter(s) in question.
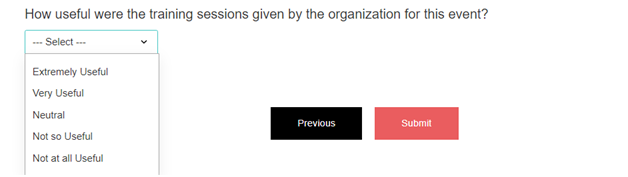
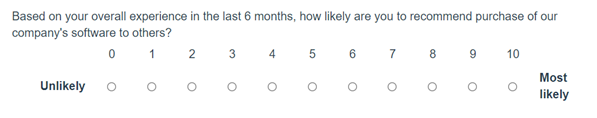
While NPS questions attempt to measure the respondents’ likelihood of recommending a particular product/service; Likert scale questions are a sound method of measuring opinions, perceptions and attitudes on various topics such as new product launch, customer service, employee feedback etc., represented by an array of choices scaling from, say ‘extremely satisfied’ to ‘extremely dissatisfied’, usually on a scale of 1-5 or 1-7. Similar to ranking questions, it is important to explain the values defined through numbers in the gradation method and clarify the context in which the pre-established dimension is being assessed. For instance,
NET PROMOTER SCORE® (NPS)-
LIKERT SCALE-
Moreover, it would be useful to apply the same rating scale across questions. This would not only help in avoiding any confusion at the participant’s end, but standard scales would also aid comparisons across questions, at the time of data analysis.
- Slider - Sliders allow participants to indicate their level of preference, actual numbers or percentages by clicking/tapping on a pointer/button and moving it along a draggable bar. These question types can effectively be used not only for questions with answers in numeric/percentage format, but also to quantify attitudes/opinions of respondents, at an individual as well as aggregate level. Illustratively,

Also, some survey platforms, such as Qualtrics, allow users to type in their answers in an open field instead of using the slider bar. If available, it would be useful to make reference to this option in the survey question itself. Further, survey platforms such as Alchemer, allow use of a ‘Slider List’ to collect feedback on multiple parameters.
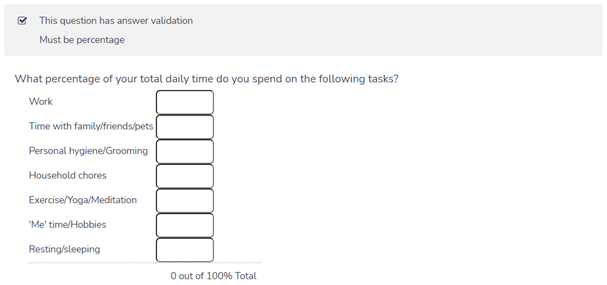
- Constant/Continuous Sum – These questions are used to gather numeric data (in numbers or percentages) for an array of items that sum up to a predefined value, exhibited to the survey-taker. For instance, while assessing total allocation of a particular parameter such as time, funds, etc. in percentage, the total should always add up to a 100%. Illustratively,
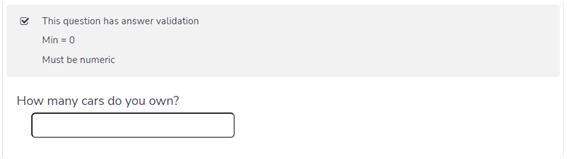
- Textbox (with numeric/percentage answer format) – These question types can be used for ratio questions requiring the respondent to type in an actual number or percentage into an open survey field, such as:
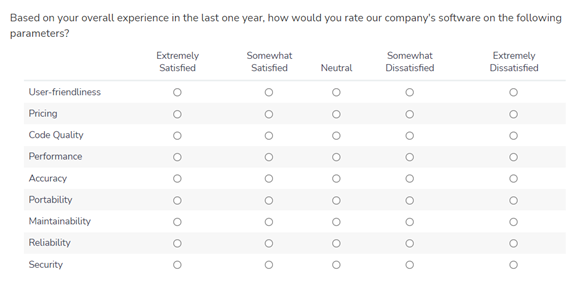
- Matrix/Grid – These are the complex question types in which the survey-taker wants to extract maximum detailed information at one go. It is essential to keep the text in these questions short, clear and focussed to avoid confusing/overwhelming the respondent with information overload. These question types can take the form of Radio-Button, Checkbox, Dropdown, Textbox (with numeric/percentage answer format) as well as Rating Scale (especially Likert scale) questions addressing multiple topics. Further, these questions help simplify large content and condense the survey length, by gathering data for a number of similar items, with a set of unchanged answer choices predefined in a row and measured on the same scale. For example, a Radio-Button Grid question could be as follows:
- OPEN-ENDED VARIABLES/QUESTIONS:
These questions allow participants to express their opinions/feelings freely in their own words. Not only are these questions time-consuming for the respondents to answer, but are also harder to compile and analyze, due to lack of consistency in the absence of predetermined answer options. Hence, it is advisable to use them sparingly. Also, it is important to frame the question as briefly and clearly as possible, as well as to contextualize it, so as to make it easier for the respondent to answer.
For example, if you want to gather feedback on your company’s product, instead of asking, ‘How is our product?’ you can frame the question as, ‘Based on your overall experience while using our product in the past, what additional product features would you recommend we incorporate going forward?’
Open-ended questions can be asked in the following format:
- Textbox/Text Entry – These question types can be used to gather detailed feedback/reasons, or personal information such as names, e-mail ids, date of birth etc. from respondents with the help of open editable survey fields. While personal details comprising of short lines of text, can take the form of ‘Short Answer/Textbox’ questions, for longer entries, the ‘Long Answer/Essay’ format can be used. For instance, an employee survey could carry the following textbox question:
To uncover opportunities and improve your product/service, it is advisable to combine closed-ended questions with open-ended ones. This would bolster quantitative data with qualitative insights. For example, after the NPS question detailed above, which measures the likelihood of users recommending a company’s software based on their experience, one can ask a textbox question, such as,
Apart from the above, various survey platforms provide for different renditions of survey question types such as – Demographic, File Upload, Timing, Image Choice, Click/Heat Map, Graphic Slider, Drill Down etc. To sum up, the key purpose to be kept in mind while selecting question types is to gather objective, unbiased and accurate data which can be analysed and interpreted correctly, in an efficient and effective manner, resulting in actionable insights.
To know more about guidelines for data analysis/interpretation and techniques of data presentation, watch for the next blog in this series.