Topics In Demand
Notification
New

No notification found.

Blog
Deep Diving Into Customer's Experience Of Mobile Brands (Report)

January 1, 2016

515

0

If we’d ask, “What’s the one thing you cannot live without every day?” We are pretty sure a majority of you would answer that it’s your smartphone. And why not? A smartphone keeps us connected, helps us travel with maps, lets us buy stuff online and so much more. With so many reasons, there are times when we tend to have a love-hate relationship with our phones. Cracks in this relationship start appearing a year after using the phone or in some cases even earlier, if you’ve made a bad purchase. The phone you bought may turn out not as you expected due to several common issues like bad performance, shorter battery life, average camera, etc. to name a few.  At this point of time, you might start thinking of switching to another phone. That’s the time when your geeky friends will suggest you phones of different brands which will suit your exact requirements, or you’ll visit PriceBaba.com and keep playing with the sliders to get various suggestions. And eventually, you’ll find that one phone of your choice.  We at PriceBaba.com tried to figure out how many users are really satisfied with their current smartphone brand. The results turned out quite surprising.  All our findings are based on the survey which was taken by 300 respondents. Our survey included rating their current smartphone brand, how loyal they are to it and if at all they would switch in future, then which would be their preferred brand.  Our findings gave us some real insights into how the new Indian, as well as Chinese brands, have managed to gain the confidence of Indian customers.  Let’s deep dive straight away in to our findings:  

Brand Owners:

Brand 

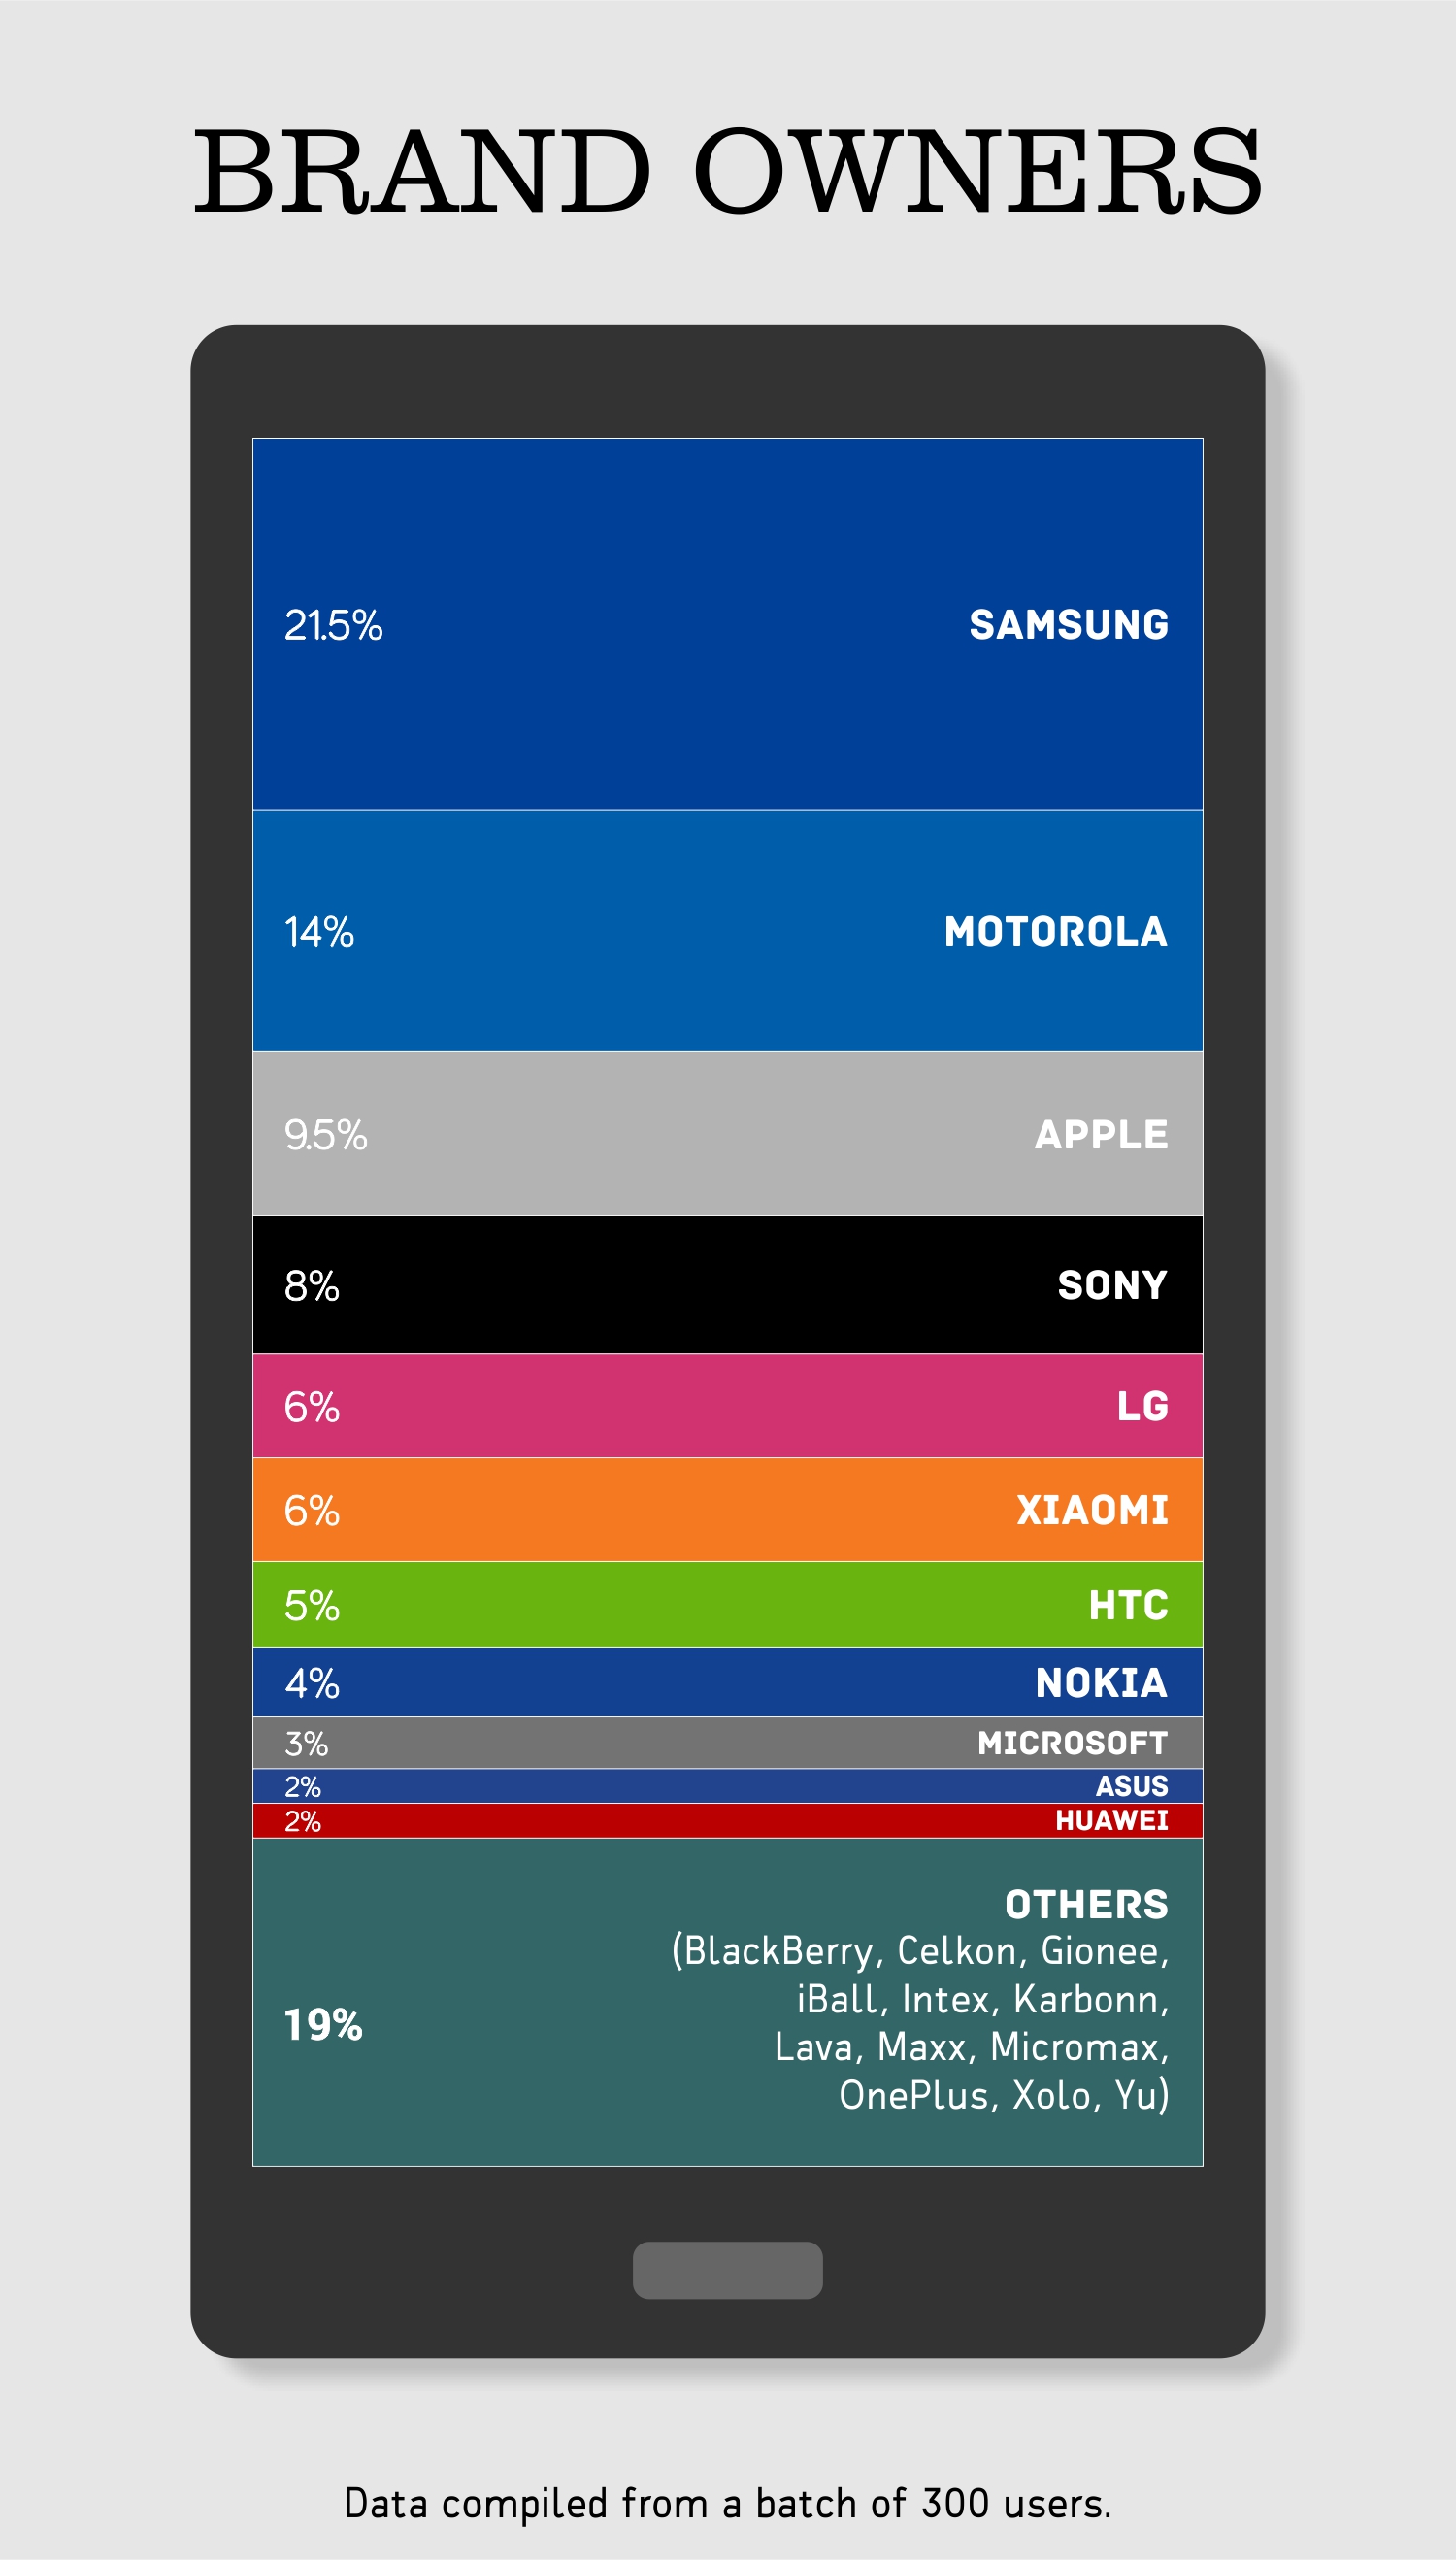
  • Out of 300 respondents, a majority of 21.5% people owned Samsung phones. Its not surprising as over the years Samsung has become the number one smartphone brand in India.
  • Motorola comes in second at 14%. The company was the first in India who managed to successfully sell phones online only. Their value for money devices like Moto G and Moto E have continued to remain popular.
  • Apple holds the third spot with 9.5% share. While the industry and customers likewise are shifting towards the trend of affordable smartphones, there’s still a considerably large amount of users who buy Apple’s expensive products, largely possible because of the company’s assumed rich-symbolic status in Indian society.
  • Xiaomi is the only new-Chinese brand which has managed to gain a position among the top five within just 9-months of entering the Indian market. It has outgunned established players like LG, HTC and Sony. The company’s budget-friendly devices with power packed specs are serving as a threat to the big players. Also, they’re largely responsible for popularising ‘affordable smartphone’ and ‘online flash sale’ trends in India.
  • Despite Nokia being sold to Microsoft, the brand still owns a 4% share, while the latter follows at 3% share. Microsoft still sells all popular feature phones under the Nokia brand.
  • After Xiaomi, Huawei and Asus are two other newly-entered International brands that have managed to gain a considerable 2% share. Their Honor and Zenfone phones have remained popular through online-only sale models.
  • Other brands which have a combined share of 19% consisted of Blackberry, Celkon, Gionee, Huawei, iBall, Intex, Karbonn, Lava, Maxx, Micromax, Microsoft, OnePlus, Xolo and YU.

     Average Brand Score:

Average

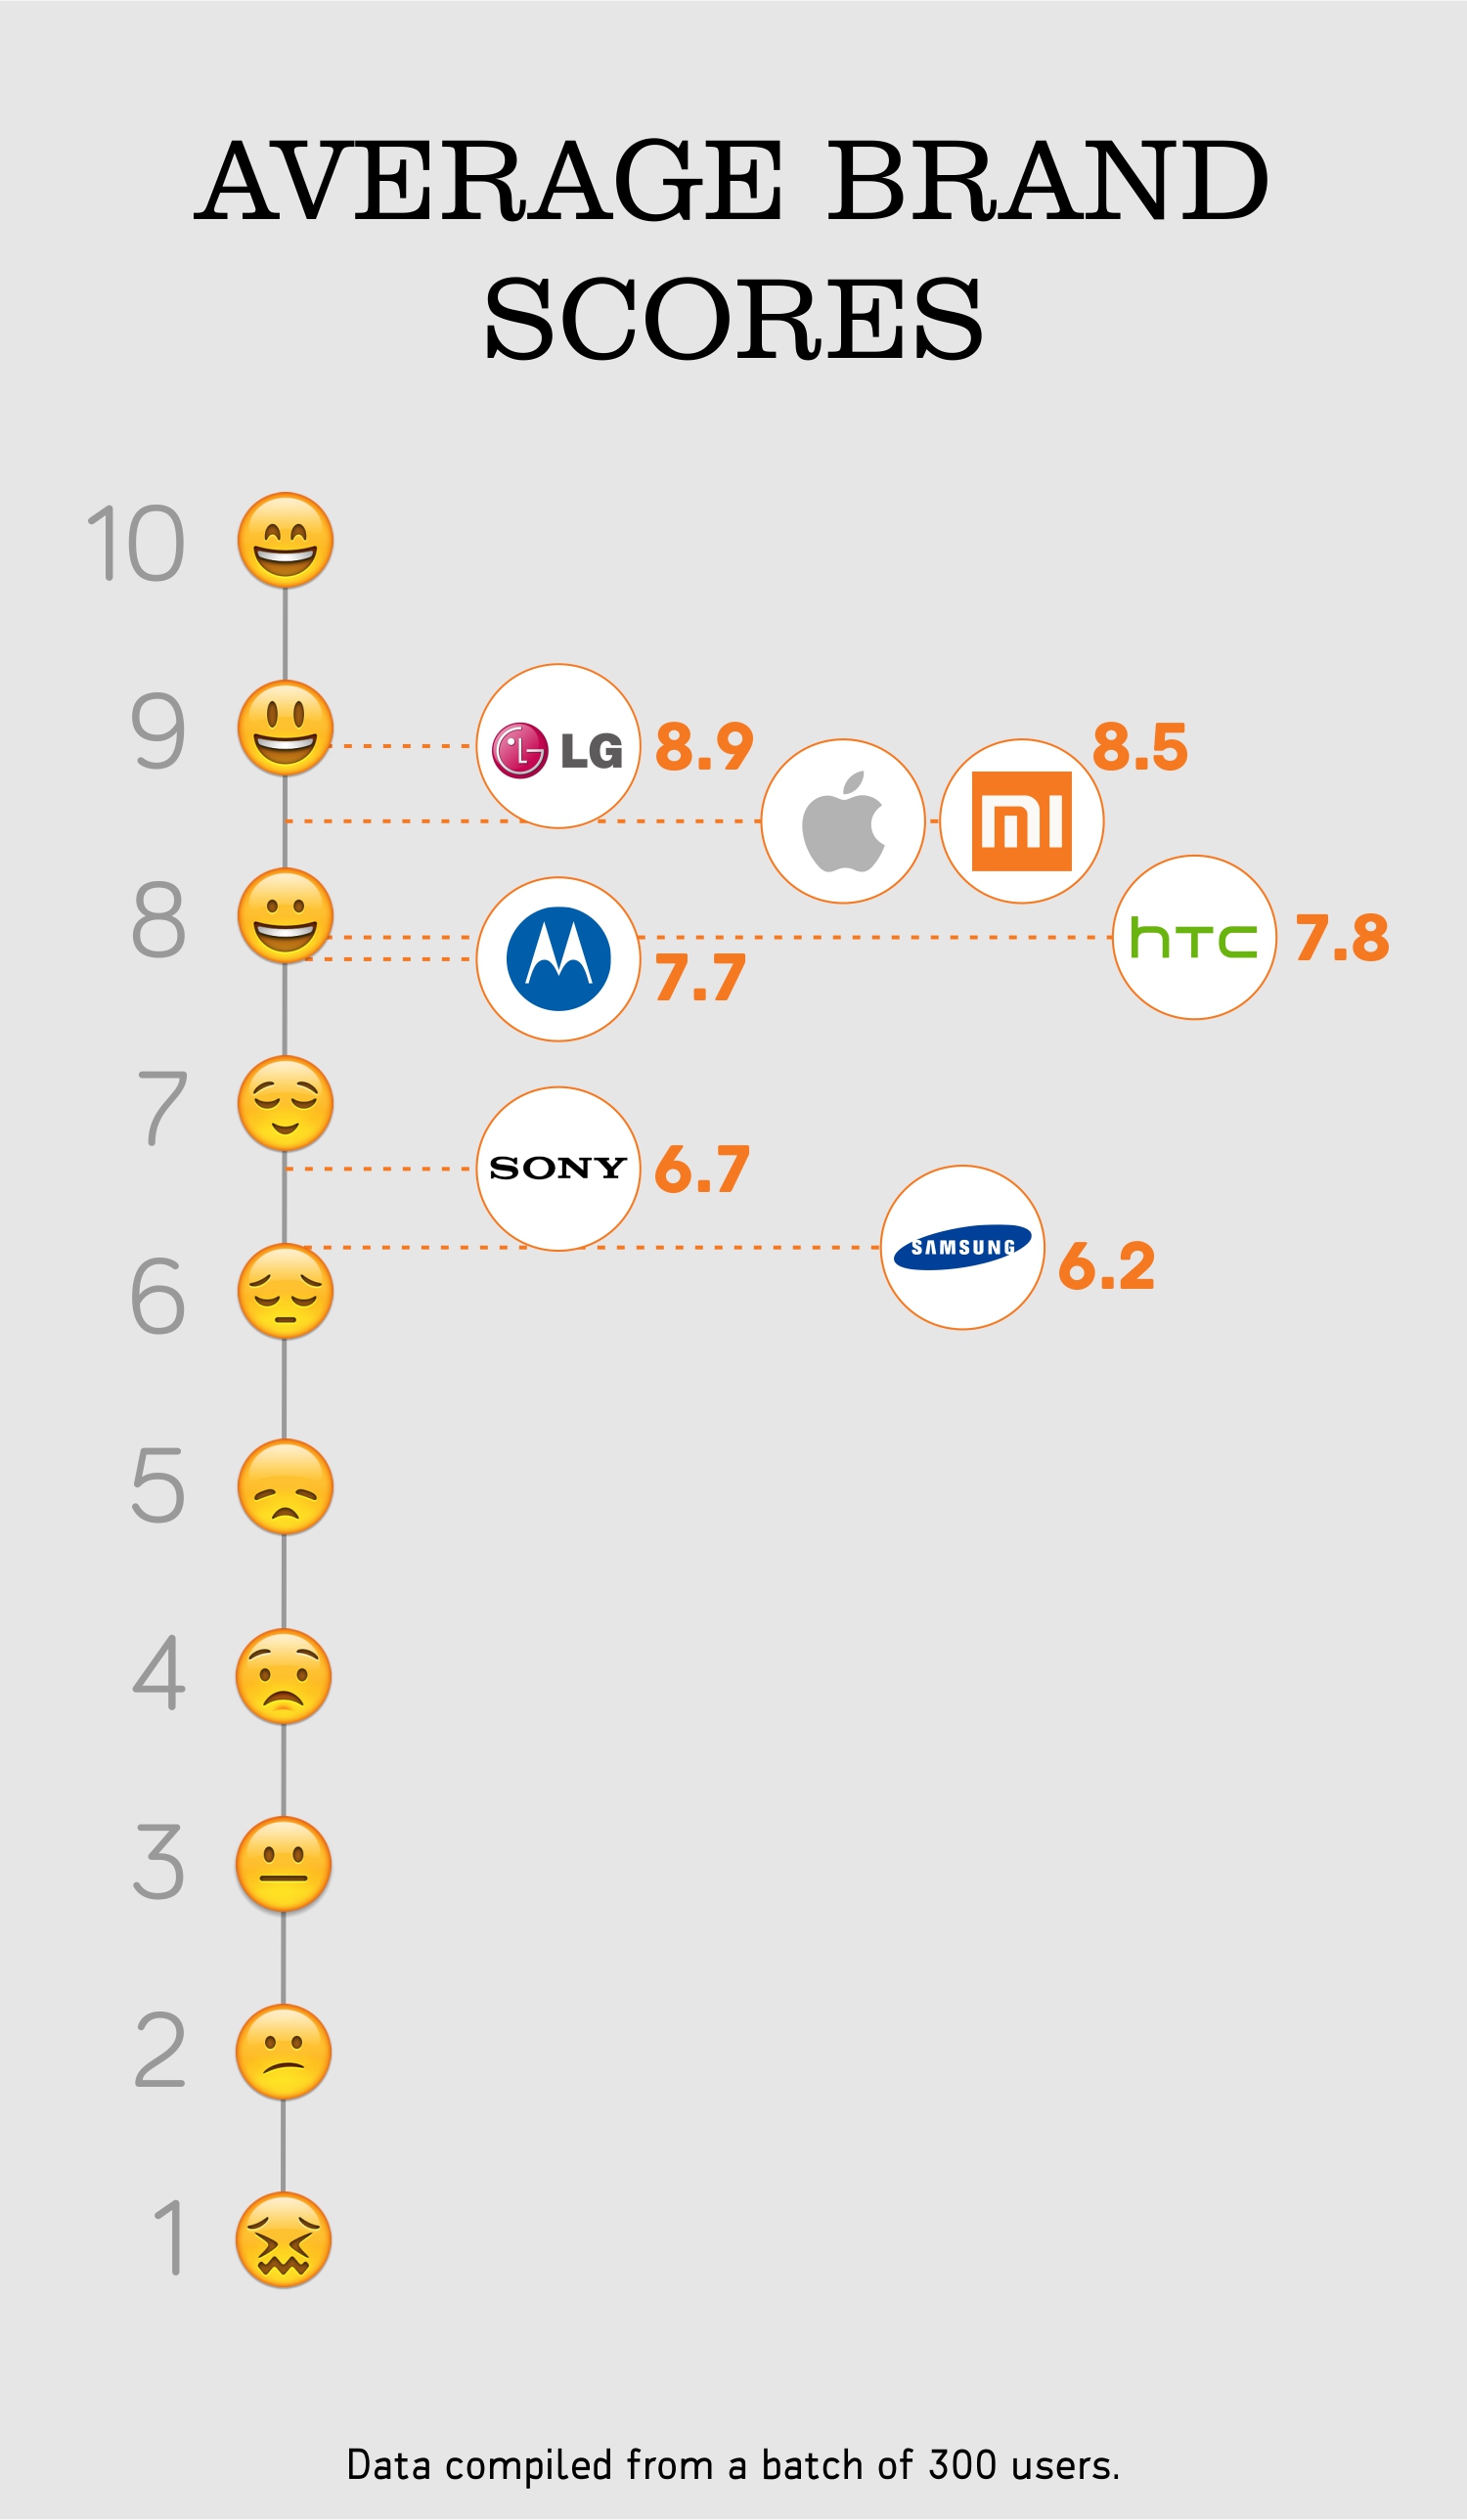
All the respondents were asked to rate their current smartphone brand based on their experience with their phone. Let’s have a look at the brands that had enough responses to calculate an average rating. LG: LG which scored 8.9 gave the highest user satisfaction to our respondents. Probably because of the LG Nexus series which runs on Stock Android and is always the first to receive any update from Google. Apple: Second comes Apple with a score of 8.5. It’s no surprise as the company has a long-standing reputation for shipping excellent quality products. Xiaomi: Third is Xiaomi with a score as same as Apple. The company has pretty much won the audience by delivering products that offer great value-for-money. HTC: Despite just having a 5% share from our respondents, HTC did manage to earn a good score of 7.8 points. Like Apple, HTC has always maintained a check on quality and their new phablets, namely, Desire 820 and 816 have gained mass appeal as the pricing is right. Samsung: Samsung with the highest brand share scored only 6.2 on the satisfaction scale. The low score might be because of Samsung’s lower-end products which have never gotten software updates and TouchWiz UI in general has been laggy on those phones. Hence we presume, the user dissatisfaction.      

Loyal Users:

Loyal

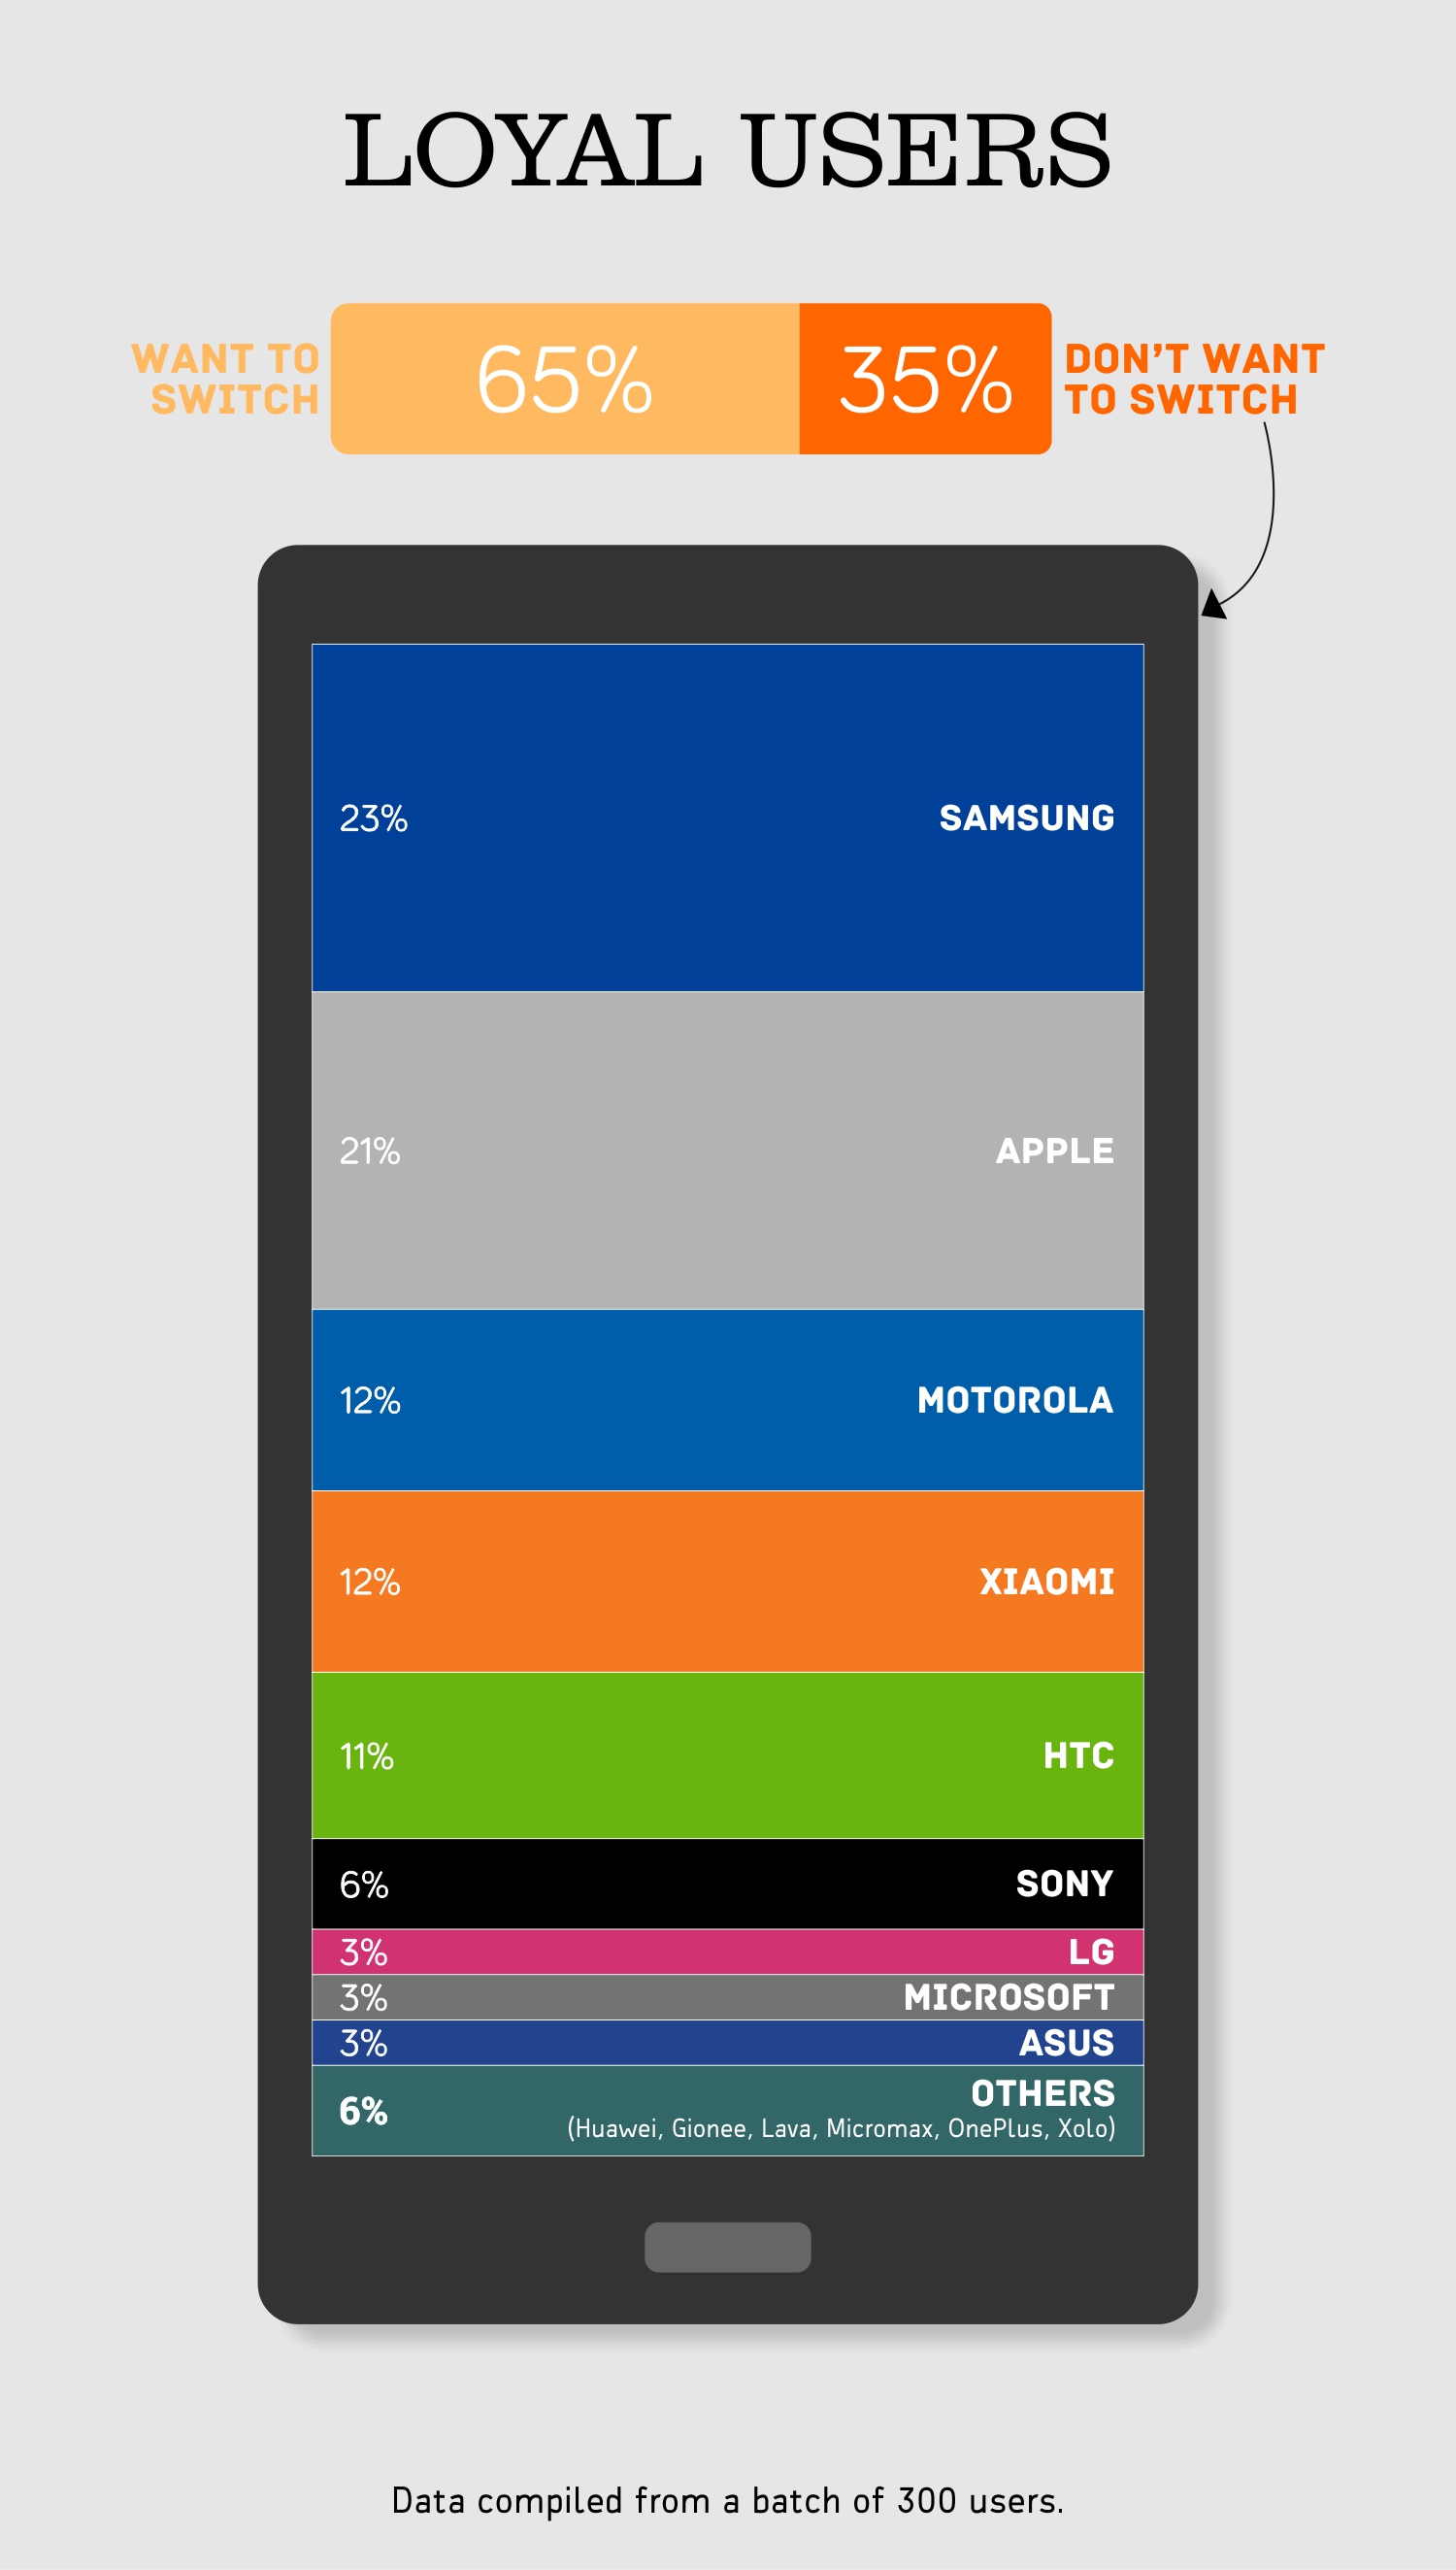
The next findings which we derived are the number of people who were not willing to switch from their existing brand. Judging by the avalanche of variety at the disposal of consumers today, 35% is a fair number and brands present in this share should take a pat on their back for keeping their users satisfied.

  • Samsung – Out of the 35% of loyal users, Samsung again takes up the top spot with 23% share. The company owns a wide variety of devices and they invest a lot in marketing them. Also, their phones have the best resale value and users tend to use Samsung phones over longer period due to that.
  • Apple – Apple comes second in the list with 21%. This could be owed to the fact that Apple has exceptional after sales service. They are also  known for a clutter free user interface and a very powerful camera.
  • Xiaomi: Third in the list is the Chinese manufacturer, Xiaomi. Within a year in India, they have already captured a significant amount of attention and generated a loyal fan base for itself in no time. The combo of power-packed hardware and a affordable price is their winning mantra.
  • Motorola: Sharing the 3rd spot with Xiaomi, the company got back in the game through near-perfect phones priced aptly.
  • HTC: Next comes HTC by contributing for 11% of the share. Over the years, the company has garnered a fair amount of loyal users, thanks to excellent hardware and recently, they’ve become more known for their best-in-class front-firing stereo speakers.

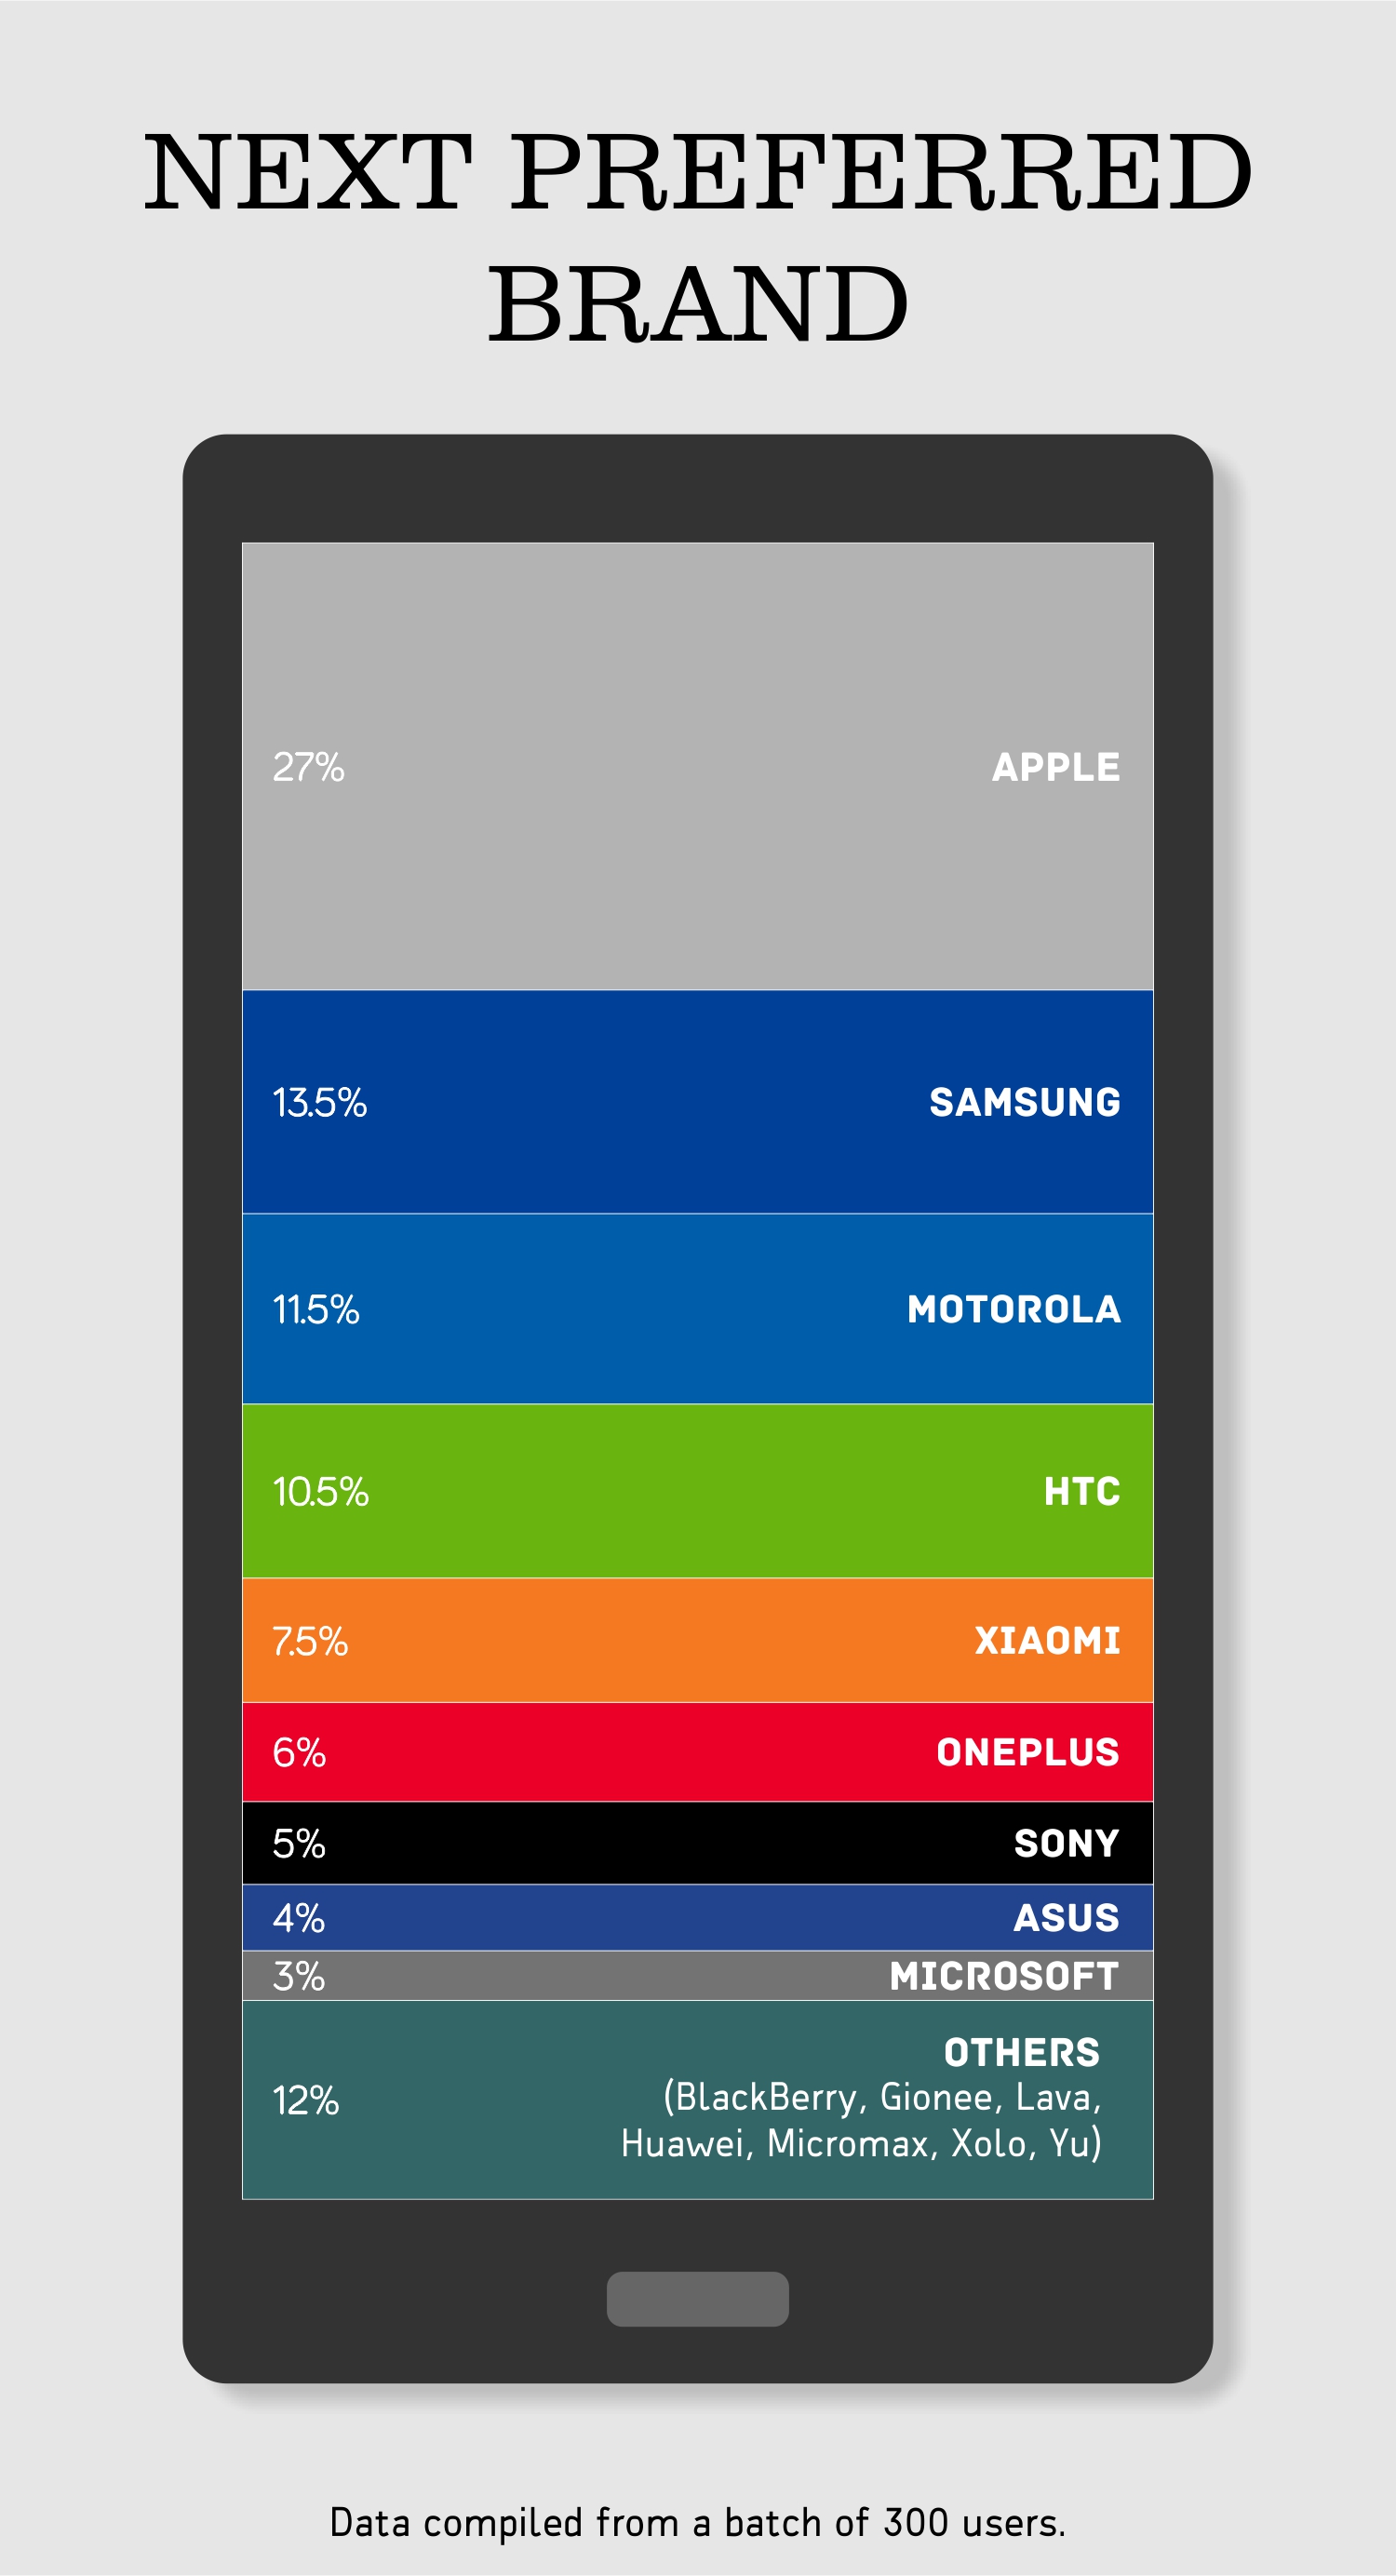
So out of the 65% who wanted to make a switch, here are the brands that were most preferred by them.      

Preferred Brands:

Preferred 

  • Winning the race with a really high margin is Apple by scoring 27%. After scoring 8.5 points as an average satisfaction score and having the most number of retained users, no wonder it is the most desired brand for people who haven’t tried it yet.
  • Scoring almost half than Apple is Samsung with 13.5%. We had the highest number of Samsung respondents and also these users were the most loyal ones to the brand. Samsung has a varied product line up for everyone tastes, and along with that they’re known to promote their phones with big spends on marketing.
  • Contributing for 11.5%, Motorola is on the third position out of all brands. Motorola had the second highest share of respondents and got an average score of 7.75. The online sales model along with the value for money devices have surely gained attention, when especially coming from a big old brand.
  • HTC comes forth just at 10.5% behind Motorola. When it comes to loyalty, HTC users have proved to be loyal and also the brand scored an average score of 8 points which is pretty good. HTC has been coming up with different phones for the mid-range users, and this will serve as a good choice for the people willing to switch.

The report was created with contribution from Ruchita Mahimkar and Kushang Dholakia.


That the contents of third-party articles/blogs published here on the website, and the interpretation of all information in the article/blogs such as data, maps, numbers, opinions etc. displayed in the article/blogs and views or the opinions expressed within the content are solely of the author's; and do not reflect the opinions and beliefs of NASSCOM or its affiliates in any manner. NASSCOM does not take any liability w.r.t. content in any manner and will not be liable in any manner whatsoever for any kind of liability arising out of any act, error or omission. The contents of third-party article/blogs published, are provided solely as convenience; and the presence of these articles/blogs should not, under any circumstances, be considered as an endorsement of the contents by NASSCOM in any manner; and if you chose to access these articles/blogs , you do so at your own risk.


© Copyright nasscom. All Rights Reserved.